Notes · errorbars
Is that 4-point eval win real?
I change a prompt, run the eval, and the score goes from 80% to 84%. Is that a win? From those two numbers, nobody can tell, because nothing in them says how big a difference this eval can separate from noise.
Eval harnesses print percentages. Almost none print an interval, a paired comparison against a control, or a power calculation. So eval sets get sized by feel, and two opposite outcomes look the same: "this change did nothing" and "this run was too small to notice" both come out as p > 0.05.
errorbars is a small open-source command-line tool and Python library I built to do that statistics. It answers two questions: how small an effect can this run see, and is this difference bigger than this run's noise?
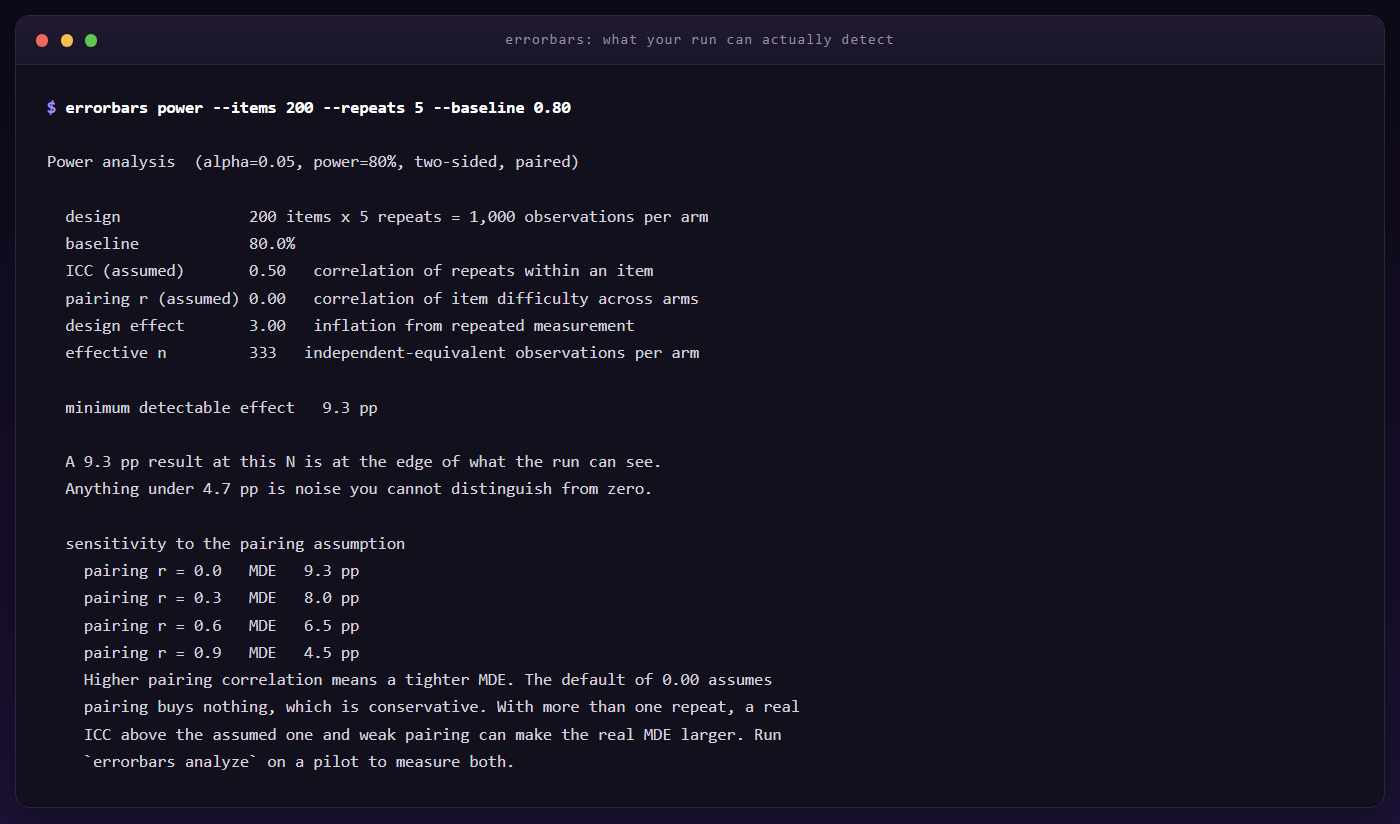
errorbars power for 200 items at 5 repeats, from the project README. No model calls and no API key.How small a difference can an eval see?
The answer is the minimum detectable effect, or MDE: the smallest difference a run of a given shape would catch with 80% power at a two-sided alpha of 0.05. errorbars power computes it from the design alone, with no model calls. For a 200-item eval with an 80% baseline:
| Design | MDE |
|---|---|
| 1 run per item | 12.3 pp |
| 5 repeats, every call independent (ICC 0) | 5.2 pp |
| 5 repeats, ICC 0.5 | 9.3 pp |
| 5 repeats, ICC 0.9 | 11.7 pp |
| 5 repeats, ICC 0.9, pairing correlation 0.9 | 3.8 pp |
Repeats help less than people expect, because a question the model reliably gets right is right all five times. The intraclass correlation (ICC) is the share of variance that lives between items rather than within them. At ICC 0.9, 1,000 calls per arm are worth about 217 independent ones.
Pairing is the large, free improvement. Most of the variance in an eval score comes from which questions you happened to pick. Run the control and the treatment on the same items, compare each item to itself, and the part of that variance shared by both arms cancels. The pairing correlation says how strongly item difficulty carries across the two arms; in the last row it takes 11.7 pp to 3.8 pp for the same 1,000 calls per arm. Even then, detecting a 2-point effect would take about 717 items at 5 repeats.
Both inputs are guesses until measured. The default pairing correlation of 0 assumes pairing buys nothing, so it never flatters the MDE; the default ICC of 0.5 can, when pairing is weak, because real evals often sit higher. Above a pairing correlation of 0.8 at 5 repeats the direction flips. errorbars analyze measures both from a pilot run.
Did nothing, or too small to tell?
This is the distinction I built the tool for. Each intervention gets one of three verdicts:
- significant: the Holm-adjusted p-value is at or below alpha.
- null: not significant, and the whole 95% interval sits inside the margin: the --sesoi you named, or by default the smallest effect this run could detect. The run could have seen an effect that size, and rules one out.
- underpowered: not significant, but the interval still includes an effect as large as the margin, so the run cannot tell no effect from an effect worth caring about.
You can set the margin with errorbars analyze <results-dir> --sesoi 2pp. By default it is the smaller of two MDEs, the power model's prediction for this design and the one implied by the precision the run achieved, because a null is a positive claim and should be the harder verdict to earn.
This is the shipped demo. It runs against a deterministic simulator in the repository, not a language model, so the numbers measure nothing real.
| Intervention | Effect | 95% CI | Holm p | Verdict |
|---|---|---|---|---|
strip-negation | -23.7 pp | [-29.3, -18.3] | <0.001 | significant |
strip-politeness | -0.1 pp | [-1.6, +1.4] | 1.000 | null |
strip-articles | -2.3 pp | [-4.6, -0.1] | 0.099 | underpowered |
After Holm correction rows two and three both miss significance, so a bare p > 0.05 prints them the same way. Uncorrected, strip-articles sits on the line at p = 0.0496. The politeness interval sits inside a ±2.2 pp margin, so that run rules out an effect of that size. The articles interval still admits a 3.2 pp effect, so the run cannot tell no effect from one worth caring about. The simulator builds in a real articles effect of about -3 pp, and a margin from the design model alone (4.8 pp) would have called it null.
What it computes
All of it is numpy and the Python standard library, with no scipy.
- Intervals: a paired percentile bootstrap that resamples items, not trials (single-arm rates with one trial per item use a Wilson interval). Trials on the same item are correlated, and resampling them gives an interval that is too narrow.
- Significance: a paired sign-flip permutation test on per-item differences, with the
(b + 1) / (B + 1)p-value from Phipson and Smyth (2010), so it never reports p = 0 when signs are sampled; at 16 items or fewer it enumerates every sign pattern exactly. - Several interventions: Holm-Bonferroni step-down. Intervals are per-comparison and p-values family-wise, and the column headers say so;
--simultaneous-cibuilds Bonferroni intervals at alpha/m so both columns control the family-wise error rate (Bonferroni is slightly more conservative than Holm, so they can still disagree). - Power: a normal-approximation model of the paired, repeated design.
errorbars analyzemeasures its two inputs as a one-way random-effects ICC(1) and a Pearson correlation of per-item scores across arms. At one repeat with no pairing it reduces exactly to the textbook two-proportion formula.
Trials that never resolved
Some trials never resolve: a truncated trace, a dropped connection. A boolean passed field has nowhere honest to put them, so the tempting fix is passed: false. errorbars reads CXS, the small results-file format shared by this family of tools, whose 0.1.1 verdict field can say inconclusive or error. Those trials are skipped, counted and reported, never put in a denominator.
On the shipped synthetic fixture, where a tenth of the trials never resolved, folding them all in as failures moves the control rate from 76.9% to 69.6%, while the effect moves only 1.7 points, because the bias lands on every arm at once. Both readings still say significant. That partial cancellation is how the bug survives review.
Checking the arithmetic
This tool has already got its own arithmetic wrong once. Partway through the build, running errorbars power on the project's own planned design, 200 items at 5 repeats, reported an effective sample size smaller than the item count. That cannot happen: effective n can never fall below the item count, and with no pairing benefit the design effect never exceeds the repeat count, so for that design it is pinned between 200 and 1,000. The power model was wrong.
It is fixed, and the arithmetic is now checked against outside references. Bootstrap 95% intervals contain the true value 94.9% of the time for one arm and 94.4% for a paired effect, over 1,000 simulated experiments. At an alpha of 0.05, the permutation test's false-positive rate under a true null is 0.051 on continuous data and 0.048 on binary data. Wilson reproduces the four reference intervals in Newcombe (1998), Holm reproduces R's p.adjust, and required N matches hand computation: 80% to 85% needs 906 items per arm. Every seed is fixed, so those figures reproduce.
What it will not do
- It is not an eval harness: no test-case management, assertion library, web UI or tracing. For a regression suite, use promptfoo. For rigorous repeated trials in Python, use Inspect AI, which already reports standard errors.
- It ships no LLM-judge scorer, because a judge adds variance nothing here models.
errorbars runis a deliberately small runner, and it will not run without a control arm: if a spec has none, it injects one and warns you.
Limits
- The bootstrap assumes items are independent. Two hundred paraphrases of five questions is really five items, and errorbars cannot detect that.
- The design-effect correction is an approximation, and everything is frequentist.
- A default null is self-referential: the interval and the run's own MDE shrink together, so a bigger run does not make null easier to earn. Pass
--sesoiand mean it. - The trials that resolved may not be representative of the ones you meant to run.
What the prior-art search cut
The original idea was a YAML-driven experiment runner for LLMs, which promptfoo and lm-evaluation-harness already provide, so the prior-art search cut it to the statistics layer, and renamed it, because the working title was already the GitHub organisation of an academic lab. The search also lists claims errorbars may never make. "No framework reports variance" is one; Inspect AI does.
The methods are not new either. errorbars builds on Evan Miller's paper Adding Error Bars to Evals: A Statistical Approach to Language Model Evaluations (arXiv:2411.00640), which the name nods to, and Anany Kotawala's Resolution Diagnostics for Paired LLM Evaluation (arXiv:2605.30315). What none of the tools I surveyed in September 2026 had was a per-intervention effect table, null results as a first-class output, and power up front. Since then a separate PyPI package, also named errorbars, has added power analysis and paired comparisons.
Try it
This errorbars is not on PyPI; the package there with the same name is a different project. Run this one from GitHub with uv:
uvx --from git+https://github.com/jimmyjames177414/errorbars errorbars power --items 200 --repeats 5 --baseline 0.80To see the verdict table, clone the repository and, from inside it, run uvx --from . errorbars run examples/negation-sensitivity.yaml --analyze. For real models, the runner talks to OpenAI-compatible endpoints. docs/statistics.md explains the power model, intervals, Holm and the verdicts for an engineer with no statistics background.
errorbars is Apache-2.0, written in Python, and on GitHub at github.com/jimmyjames177414/errorbars. If you have an eval result you have been quoting without an interval, run errorbars power on its design. I would like to hear what it says.